Overview
A bone density test checks how strong your bones are. It can show whether you might have osteoporosis. Osteoporosis is a condition that makes your bones weak and more likely to break.
The most common test for measuring bone mineral density is called a DXA or DEXA scan. DXA is short for dual-energy X-ray absorptiometry.
The test uses X-rays to measure the amount of calcium and other minerals in your bones. The more minerals your bones contain, the denser and stronger they are. Stronger bones are less likely to break.
A DXA scan typically is done on the bones that break easily. The bones that are tested most often are in the spine and hip. Sometimes the bones in the forearm are tested.
Products & Services
Why it's done
Bone density
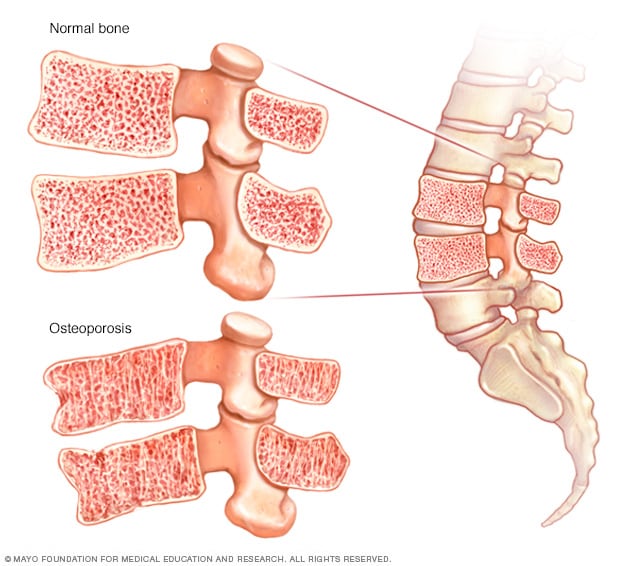
Bone density
With bone loss, the outer shell of a bone becomes thinner, and the inside becomes more porous. Healthy bones are strong and flexible. A bone with osteoporosis is weaker and may break more easily.
Healthcare professionals use bone density testing to:
- Find early signs of bone loss before a break happens.
- Estimate your risk of breaking a bone in the future.
- Confirm if you have osteoporosis, a condition that weakens bones.
If you already have osteoporosis, bone density tests can track how well your treatment is working.
A bone density test is different from a bone scan. A bone scan involves an injection and typically is done to find issues such as fractures, infections or cancer in bones. A bone density test does not involve an injection.
Osteoporosis is more common in older women, but older men can have it too. No matter your age or sex, your healthcare professional may recommend a bone density test if:
- You've lost height. Losing 1.5 inches (about 4 centimeters) or more may be a sign of small fractures in your spine from osteoporosis.
- You've broken a bone easily. Called fragility fractures, these breaks can happen from something as minor as a cough or sneeze if your bones are very weak.
- You take steroid medicines. Long-term use of steroid medicines such as prednisone can slow down the body's ability to rebuild bone. This raises your risk of bone loss.
- Your hormone levels have dropped. There is a natural drop in hormones after menopause. And certain cancer treatments can cause hormone levels to drop, including some treatments for prostate cancer that lower testosterone. Lower hormone levels can make bones weaker.
More Information
Risks
While bone density tests are helpful, they have some limitations:
- Different testing methods. Tests that measure density in the spine and hip are more accurate than those that check the bones in the forearm, finger or heel.
- Spinal conditions. If you have certain spine conditions, such as arthritis or scoliosis, or have had past spine surgeries, your test results may not be as accurate.
- Radiation exposure. Bone density testing uses a small amount of X-ray radiation. The exposure is very low, but the test typically is avoided during pregnancy.
- Doesn't show the cause. A bone density test can show if you have low bone density, but it can't tell what's causing it. Your healthcare professional may order other tests to find out more.
- Insurance coverage. Medicare and some insurance plans may cover this test every two years for people at risk. Check your health insurance plan to see if your test will be covered.
How you prepare
Bone density tests are easy, fast and painless. Almost no preparation is needed.
- Let your healthcare professional know if you've recently had a barium test or had contrast for a CT scan or nuclear medicine test. These could interfere with the bone density scan.
- Don't take calcium supplements for 24 hours before the test.
- Wear loose, comfortable clothes without zippers, buttons or belts. Leave jewelry at home. Remove any metal items from your pockets, such as keys or coins.
What you can expect
Locations for bone density testing
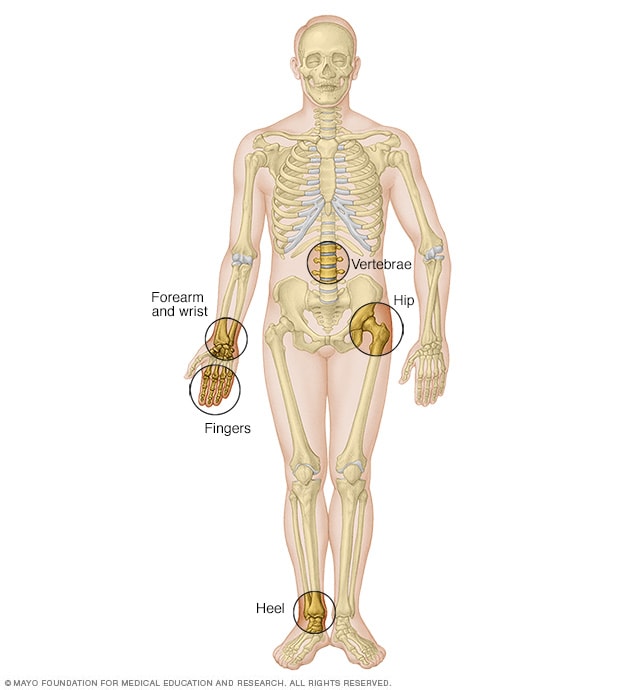
Locations for bone density testing
Bone density tests are usually done on bones in the spine (vertebrae) and hip. But they also can be done on the forearm, wrist, fingers and heel.
Bone density tests check the bones most likely to break due to osteoporosis. These include:
- The bones in your lower back, called your lumbar spine.
- The upper part of your thighbone near your hip.
- The bones in your forearm.
If your test is done at a hospital or clinic, you'll likely lie on a padded table while a scanner arm moves over your body. The test is painless. It takes 10 to 30 minutes. The amount of radiation you're exposed to is very low — much less than a chest X-ray.
Some bone density tests are done using a small, portable device that checks bones at the end of your limbs, such as your finger, wrist or heel. These are called peripheral tests. They are typically offered at health fairs or community events.
While peripheral tests can be useful for screening, they aren't as accurate as tests done on your spine or hip. If a peripheral test shows low bone density, your healthcare professional may recommend a follow-up scan on your spine or hip to confirm the results.
Results
Your bone density test gives you two scores: the T-score and the Z-score.
T-score
The T-score compares your bone density to that of a healthy young adult. It shows how much higher or lower your bone density is compared to that standard.
Here's what the numbers mean:
- -1 and above. Your bone density is healthy.
- Between -1 and -2.5. You have osteopenia, which means your bone density is below healthy levels and may lead to osteoporosis.
- -2.5 and below. You likely have osteoporosis, a condition that weakens bones and increases the risk of fractures.
Z-score
The Z-score compares your bone density to what's typical for someone your age, sex, weight, and racial or ethnic background.
If your Z-score is much higher or lower than expected, your healthcare professional may recommend other tests to figure out why.